SockPerf is a network testing tool designed to measure network latency.
The tool can create UDP/TCP data streams and measure the throughput and latency of a network.
The tool provides both client and server functionality and can measure the throughput and latency between two endpoints.
This tool includes a histogram with various percentiles, such as the 50th and 99th percentile.
The 50th percentile shows the latency value for which 50 percent of the observations are smaller than it.
The 99th percentile shows the latency value for which 99 percent of the observations are smaller than it, and 1 percent are higher.
These percentiles are helpful in analyzing spikes in network traffic, and go beyond just the average latency and standard deviation.
To install sockperf run the following commands
sudo apt-get -y install sockperf
In this example, we will test the latency between Server 1 and Server 2 using port 443.
Server 1 IP: 192.168.67.145
Server 2 IP: 192.168.67.147
Login to Server 1 and run the following command.
sudo sockperf sr –tcp -p 443#
Login to Server 2 and run the following commands for different tests
ping-pong test – run sockperf client for latency test in ping pong mode;
sudo sockperf ping-pong -i 192.168.67.145 –tcp -m 350 -t 101 -p 443 –full-rtt
To measure latency statistics, after the test completes, sockperf calculates the route trip times (divided bytwo) between the client and the server for all messages, then it provides the average statistics and histogram.
under-load test – run sockperf client for latency under load test;
sudo sockperf under-load -i 192.168.67.145 –tcp -m 350 -t 101 -p 443 –full-rtt
throughput test – run sockperf client for one way throughput test;
To determine the maximum bandwidth and highest message rate for a single-process, single-threaded network application, sockperf attempts to send the maximum amount of data in a specific period of time.
sudo sockperf throughput -i 192.168.67.145 –tcp -m 350 -t 101 -p 443 –full-rtt
reversed throughput test
To test the reverse throughput, we need to swap Server 1 and Server 2 using the following commands.
Login to Server 2 (192.168.67.147) and run the following command.
Server2=Ip Address=192.168.67.147
sudo sockperf sr –tcp -p 443
Login to Server 1 (192.168.67.145) and run the following command.
sudo sockperf throughput -i 192.168.67.147 –tcp -m 350 -t 101 -p 443 –full-rtt
The -t option sets the testing time in seconds. About 100 seconds is long enough to return representative results.
The -m denotes message size in bytes. A 350-byte message size is typical for an average packet.
The average latency for a given one-way path between the two machines is the average RTT divided by two.
Here is an example of the results I am getting on my Hyper-V server. Both servers are on the local LAN.
ping-pong test
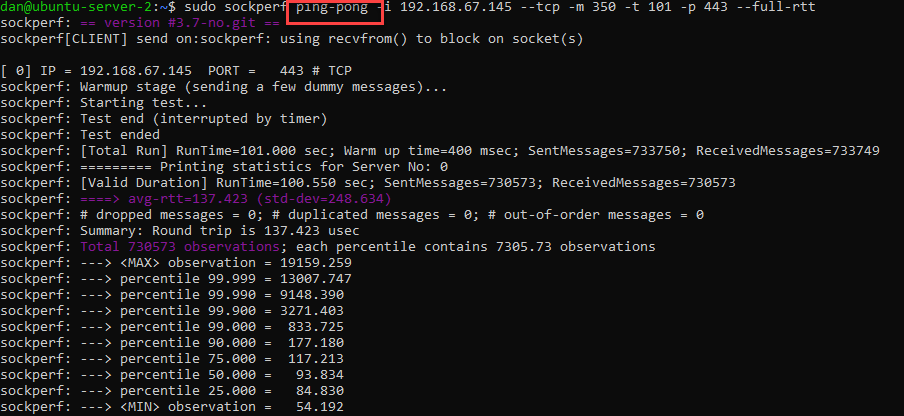
We have an average round-trip time (RTT) 137.42 usec = 0.137ms.
The latency number is half of RTT = 0.065 ms
under-load test
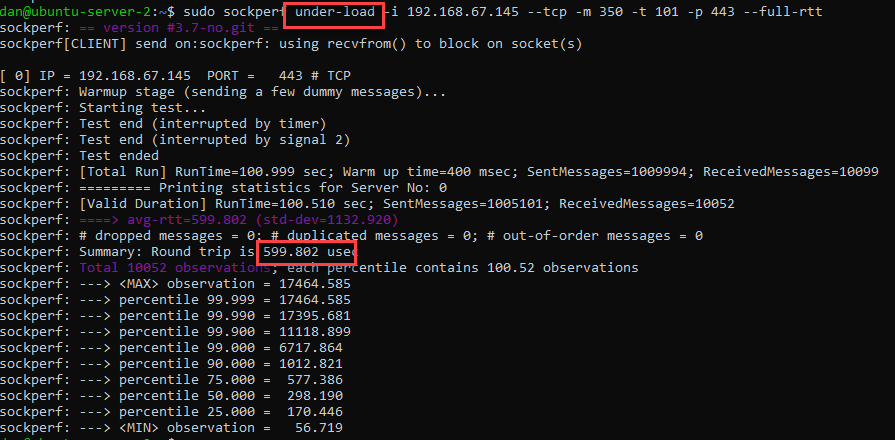
599,809 usec = 0.599 ms
We have average round-trip time (RTT) 599,809 usec = 0.599 ms
The latency number is half of RTT = 0.29 ms
Throughput test
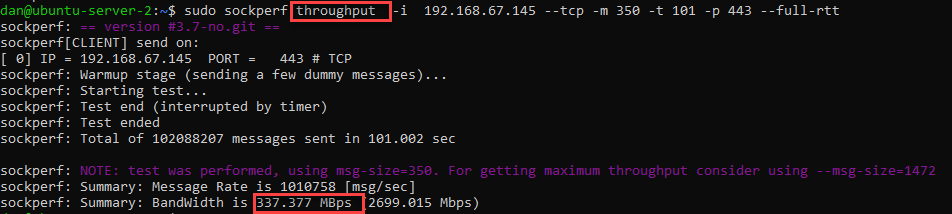
Bandwidth is 337 Mbps
Throughput test reversed
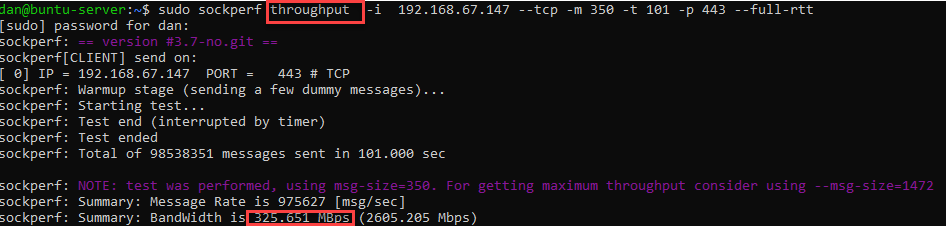
Bandwidth in another direction is 325 Mbps
More information can be found here,
https://manpages.ubuntu.com/manpages/jammy/man1/sockperf.1.html